Create Dashboards

Objective

In this comprehensive guide, we will walk you through the process of creating and customizing dashboards in Power Apps, a fundamental component of the Power Platform. Dashboards allow you to organize and display various components in one place, providing a consolidated view of data and insights.


The Purpose of Creating Dashboards:
Creating and customizing dashboards in Power Apps serves several key purposes:
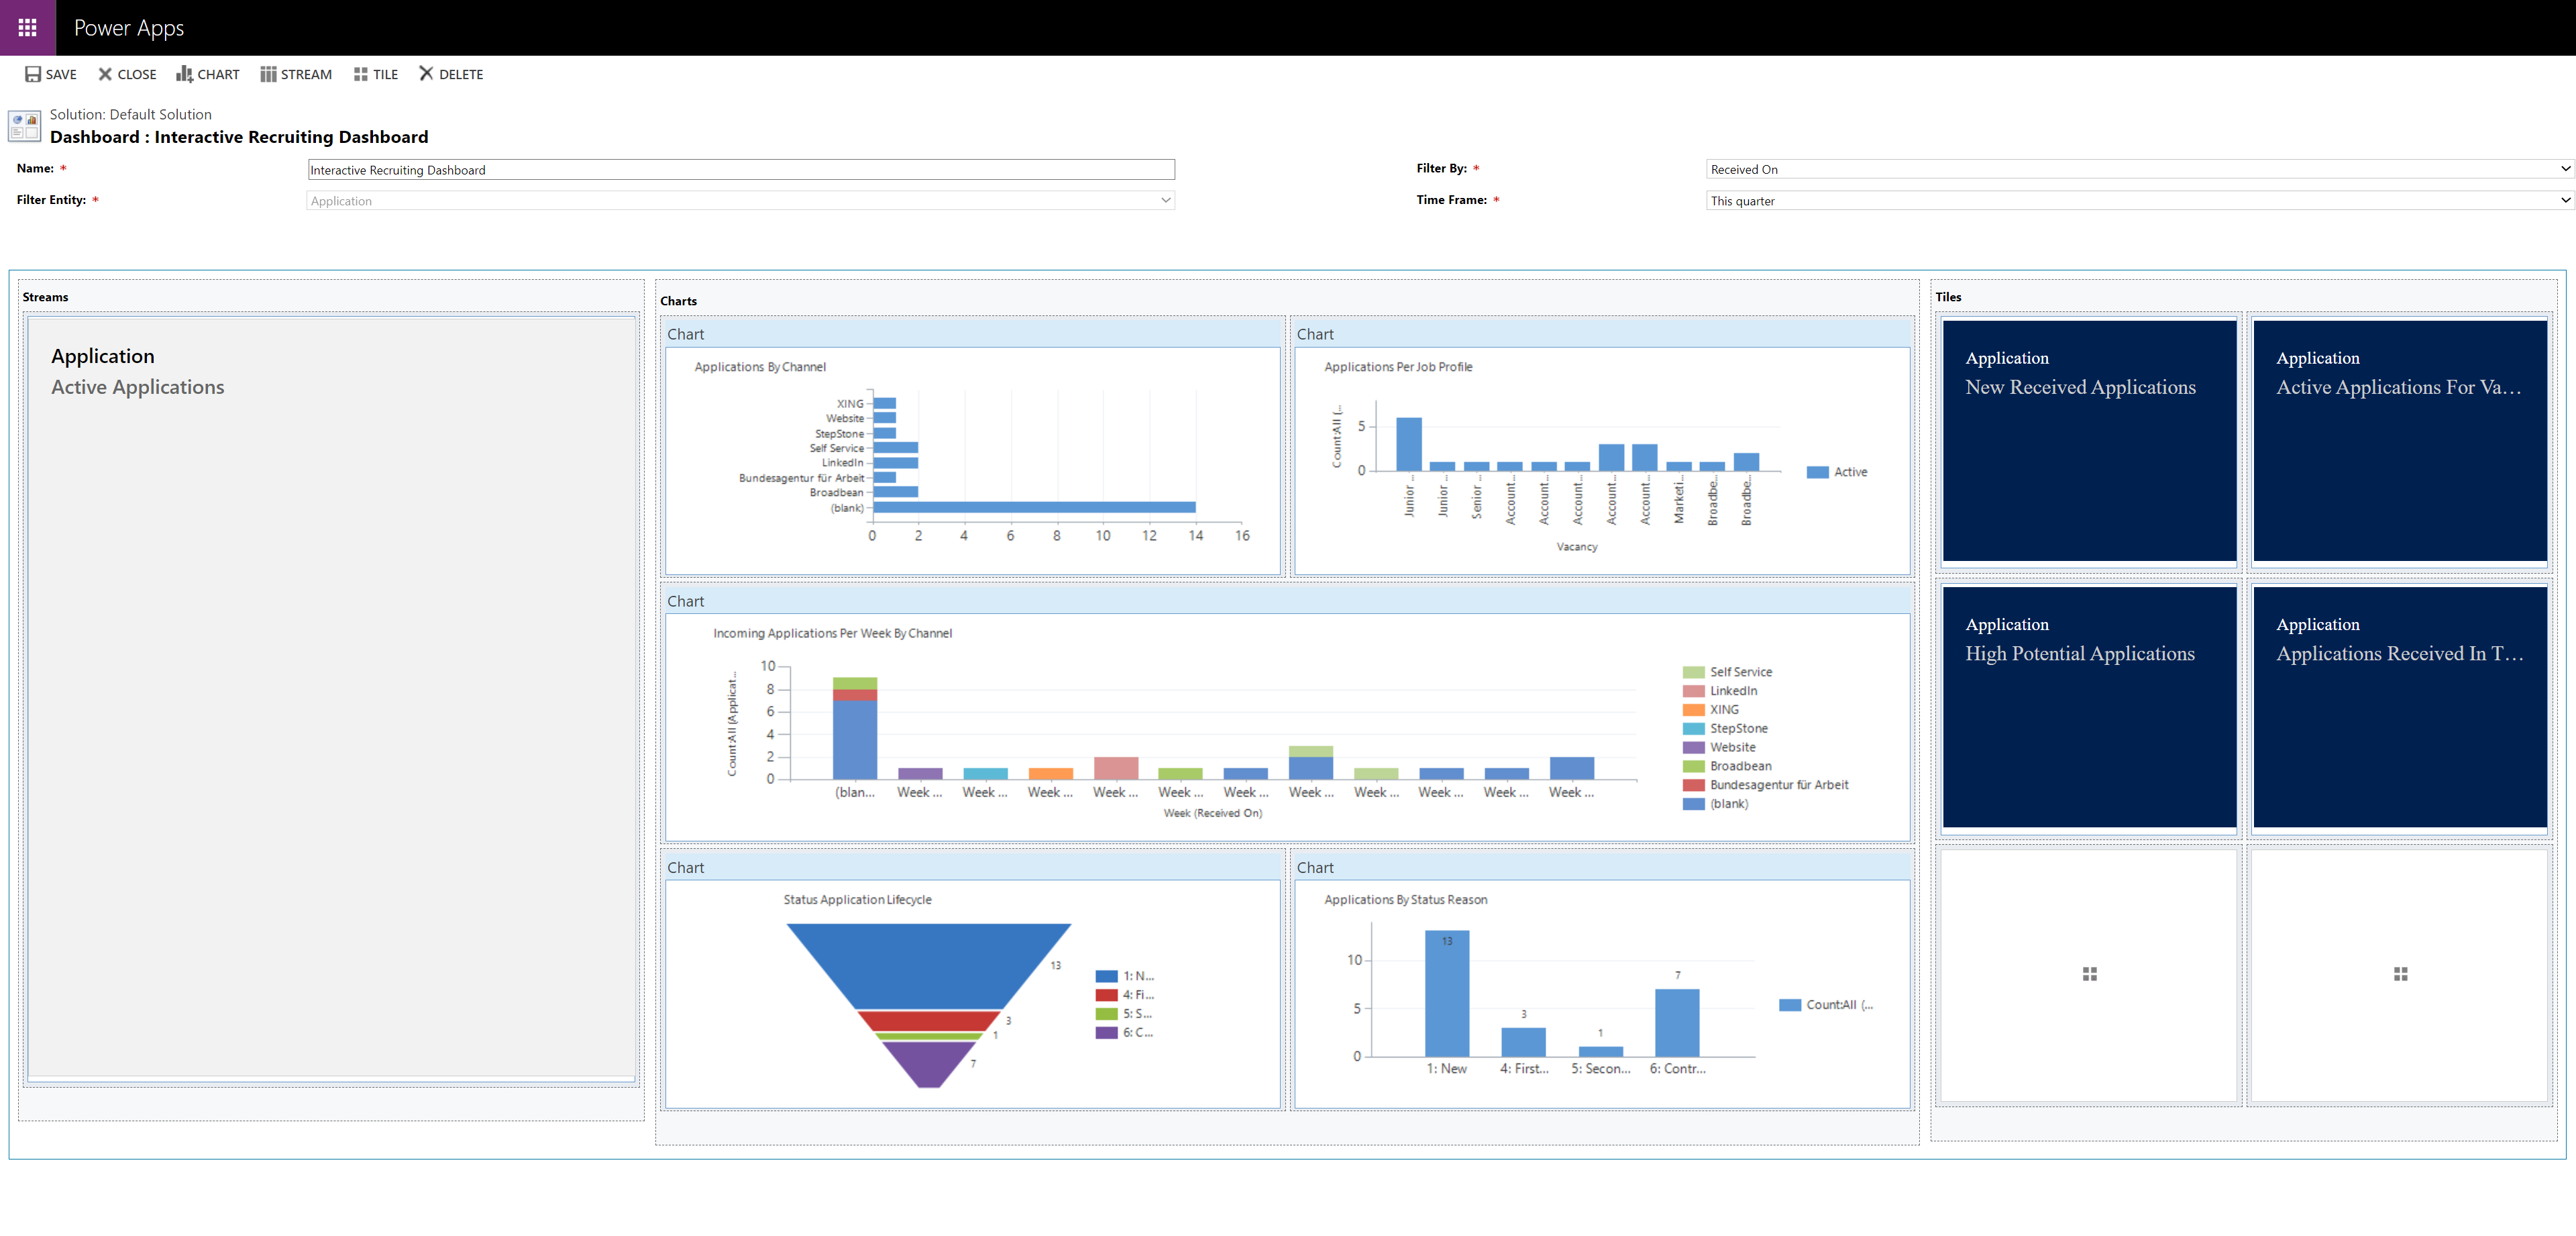
- Data Aggregation: Dashboards aggregate data and insights from multiple sources to provide a consolidated view.
- Visual Data Presentation: Customize dashboards to visually present data, such as charts, lists, and reports, for better data analysis.
- User-Focused Insights: Dashboards are user-centric and can be tailored to different user roles, providing relevant information for their tasks.

Prerequisites

  • Access Permissions: Make sure you have the necessary permissions to modify dashboards within the app. (Minimum 'System Customizer'-Security Role or Admin)
  • Data Sources: Familiarize yourself with the data sources and entities that you want to include in the dashboard. Before you can create Dashboards you should create Views and Charts, depending on what you want to showcase and visualize.

Click Through

Step 1: Open the Power Platform Step 2: Navigate to the Environment
  • Choose the specific environment where you want to customize dashboards. Click on the top-right environment name to enter it.
Step 3: Navigate to the correct Solution
  • Click on Solution in the left navigation.
  • Open your storage for customization (see a guide on how to create one here)
Step 4: Access the Entity (Table) for Customization
  • In your chosen Solution, you see all Objectives
  • Navigate to Dashboards and click on it
  • Now choose the specific dashboard you want to customize. Click on it or create a new Dashboard with +New, then Dashboard
  • You have several Options depending on which Layout-Template you would like to use.
Step 5: Select the Dashboard to Customize
  • In the "Dashboards" section, you will see a list of available dashboards. Choose the dashboard you want to customize by clicking on its name.
Step 6: Start Customizing
  • Click on the "Edit" or "Customize" button to enter the customization mode for the selected dashboard.
Step 7: Add Dashboard Components
  • While in customization mode, you can add various components to the dashboard, including views, charts, lists, web resources, and related records.
  • For example you would like to add a chart where all Attendances from last week are shown for the Logged in User.
    • Click on +Chart on the top
    • Select the Record which is Attendance
    • Select the View - My Attendance
    • Select the Chart Attendance last week - by employee
    • Click on Add
Step 8: Rearrange and resize components
  • Customize the layout by rearranging and resizing the components as needed. You can create multiple sections and columns to organize the dashboard content.
Step 9: Set Component Properties
  • Configure the properties of each component, including data sources, filters, and display options.
Step 10: Save and publish your Changes
  • Once you've made the desired modifications, don't forget to save and publish your changes, by clicking on Dashboards in the left Navigation bar (Objects) and press the Button Publish all customizations

Hint

  • Before you create a Dashboard, make sure you know what you would like to showcase. Since you are in the Dashboard section, you can not create new Charts or Views here. You are just allowed to select existing ones.
  • To create customized Charts or Views, please see the respective tutorials to design charts and customize views.

Result

Your customized dashboard is now ready for use in your Power App. Dashboards provide a consolidated view of data and insights, offering a user-friendly and insightful way to access relevant information.
Below, you see an example for a customized dashboard.
Image
HR